Reports
The web service included in ledger allows for the configuration of many types
of different reports, charts, and calculations.
Lets try an example configuration.
[[report]]
name = "PQ Expenses"
chart = "pie"
date_range = "Previous Quarter"
accounts = [ "Expenses:*" ]
[[report]]
name = "PY Expenses"
chart = "pie"
date_range = "Previous Year"
accounts = [ "Expenses:*" ]
[[report]]
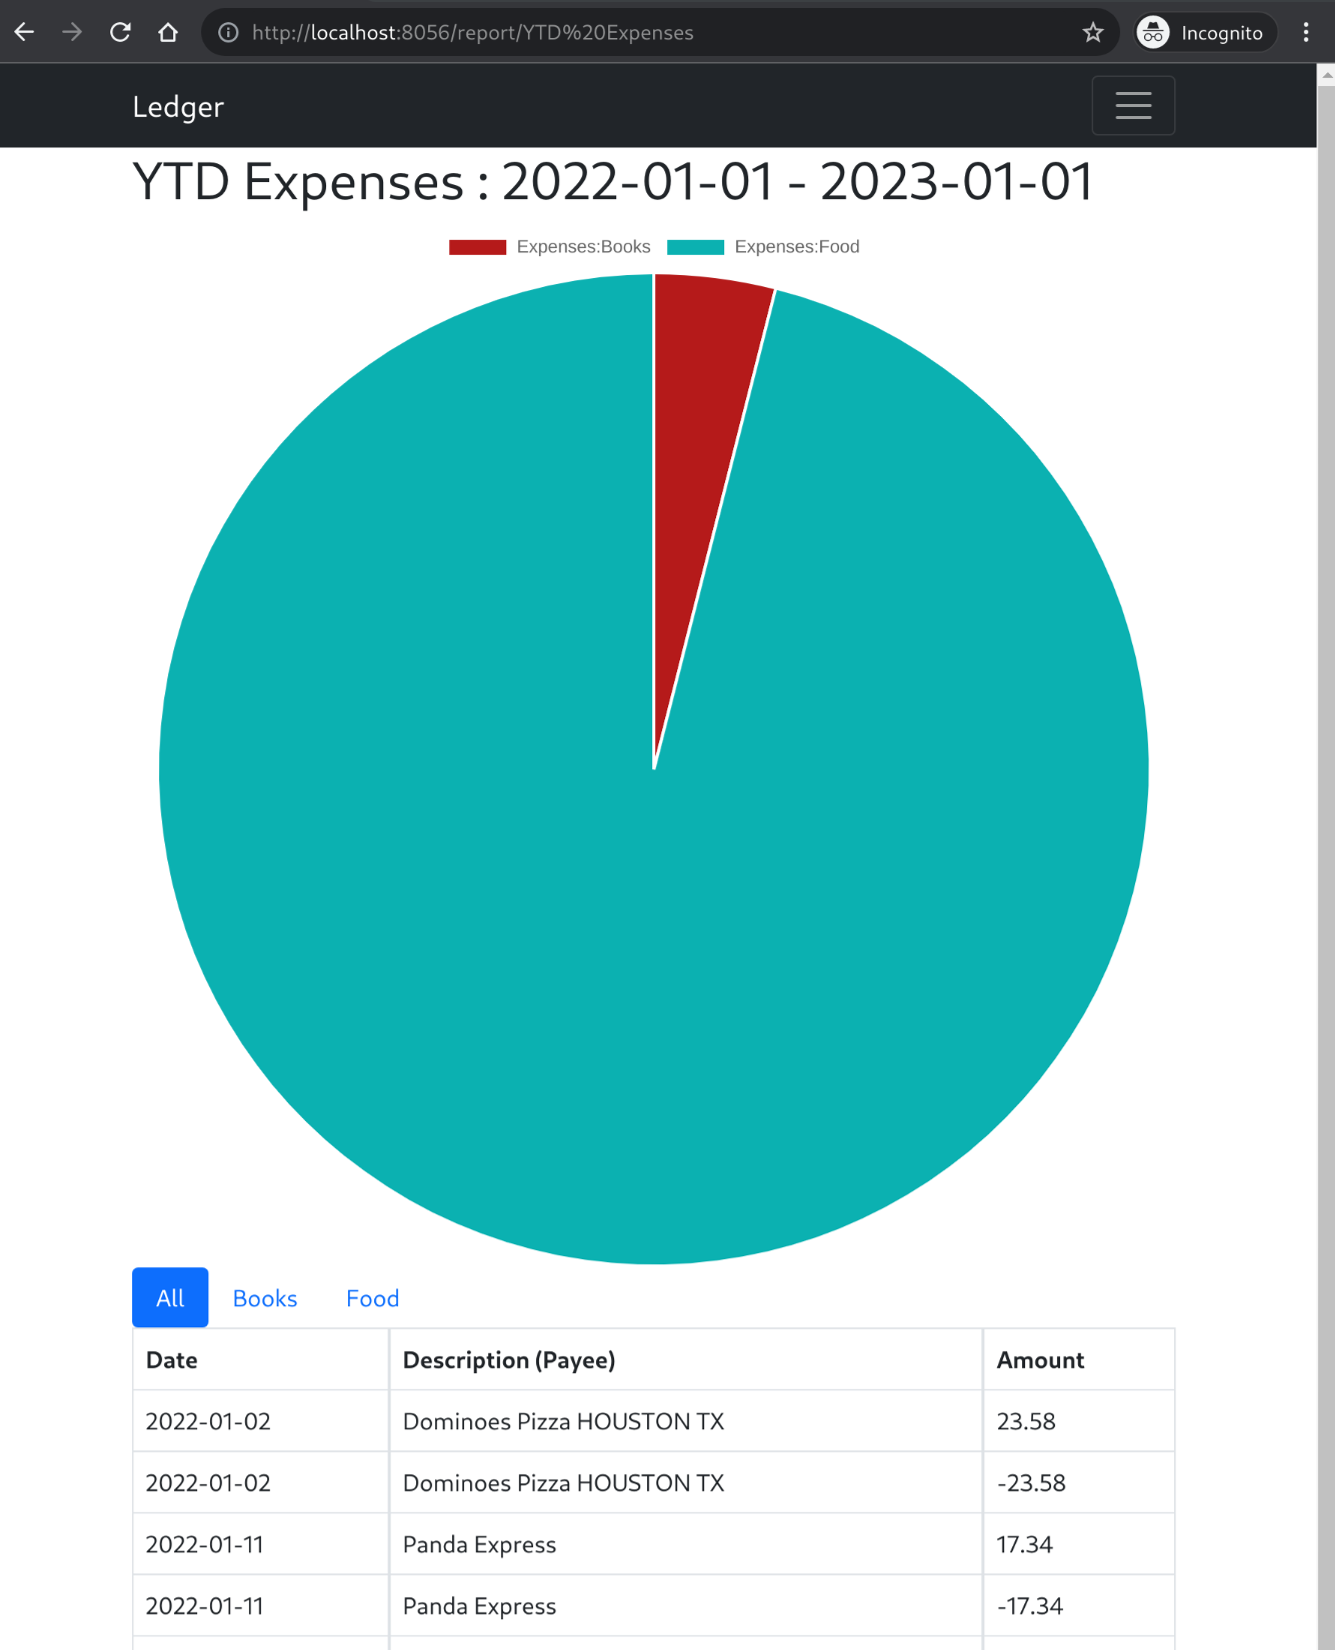
name = "YTD Expenses"
chart = "pie"
date_range = "YTD"
accounts = [ "Expenses:*" ]
[[report]]
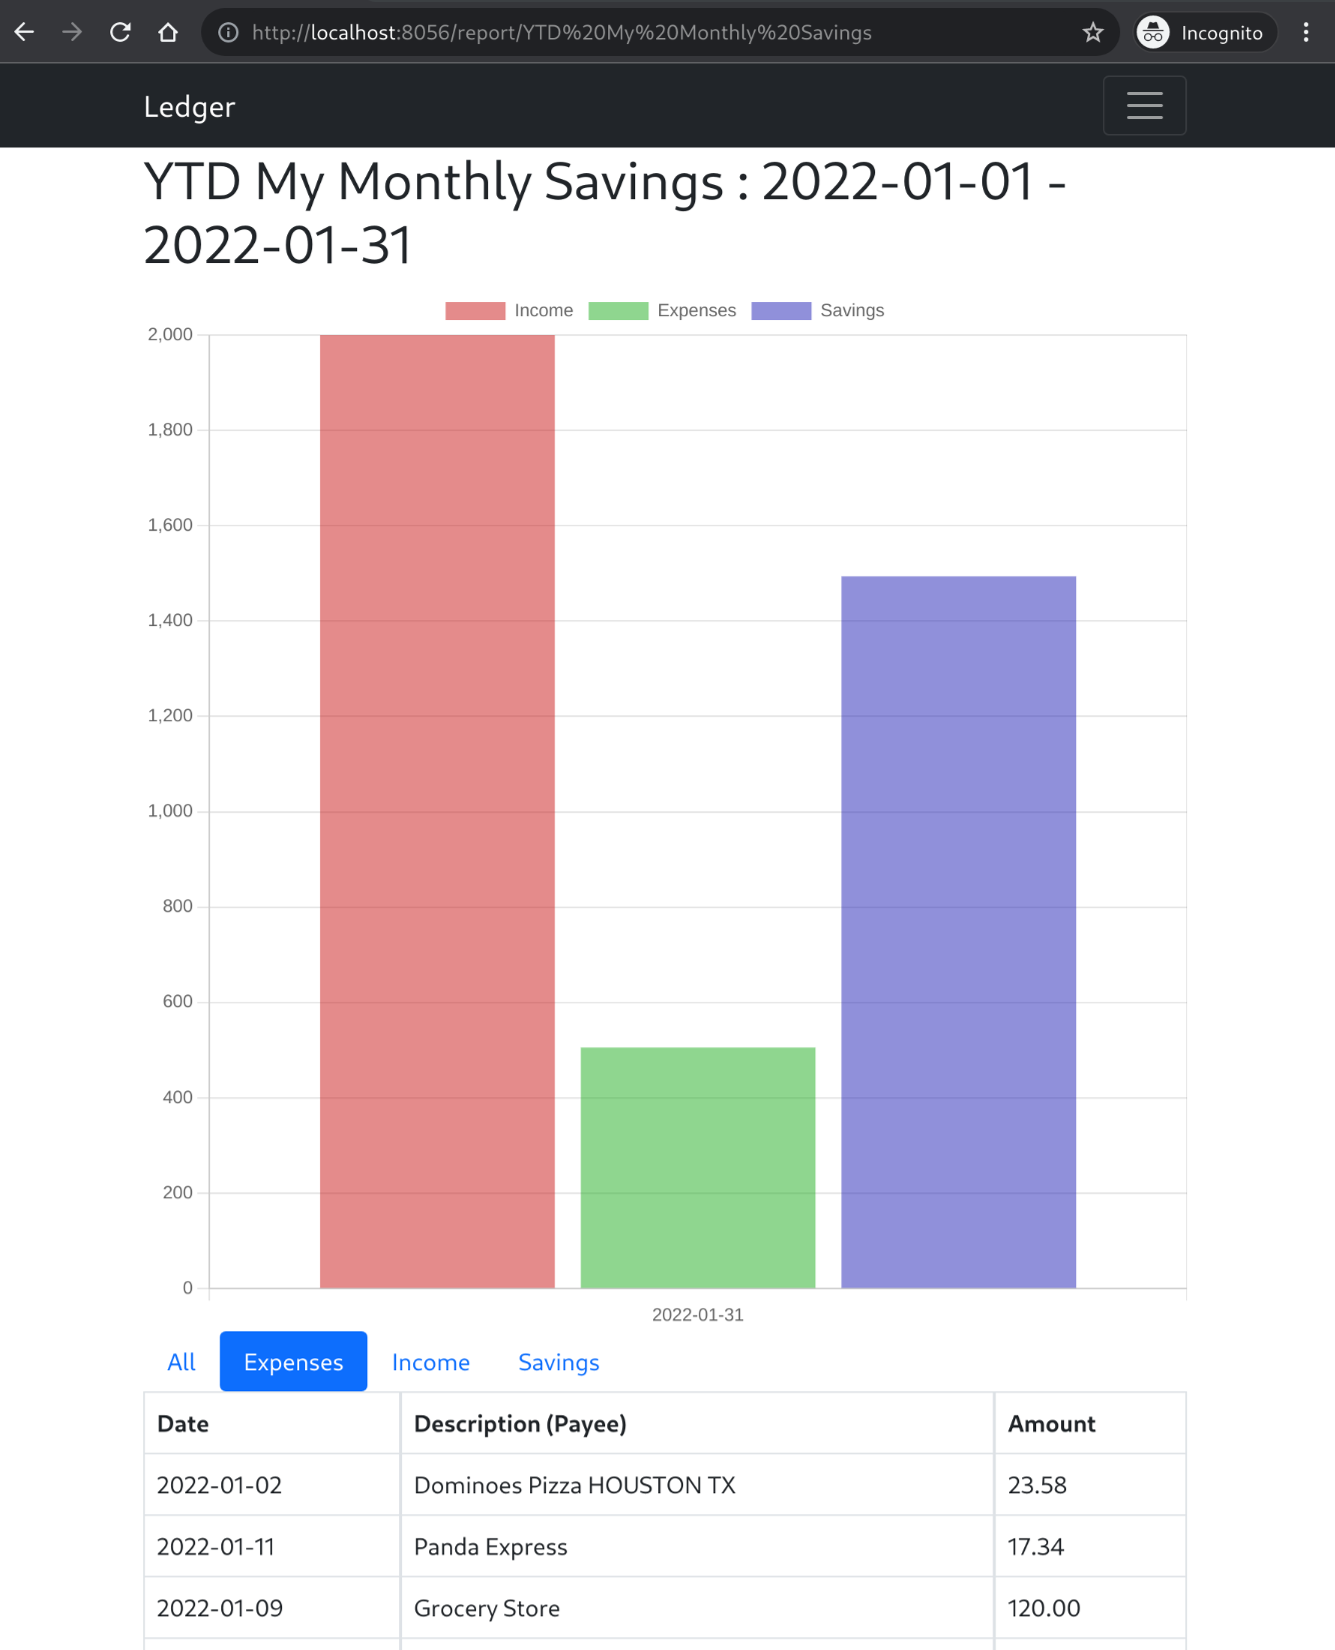
name = "YTD My Monthly Savings"
chart = "bar"
date_range = "YTD"
date_freq = "Monthly"
accounts = [ "Income", "Expenses" ]
[[report.calculated_account]]
name = "Savings"
[[report.calculated_account.account_operation]]
name = "Income"
operation = "+"
[[report.calculated_account.account_operation]]
name = "Expenses"
operation = "-"
[[report]]
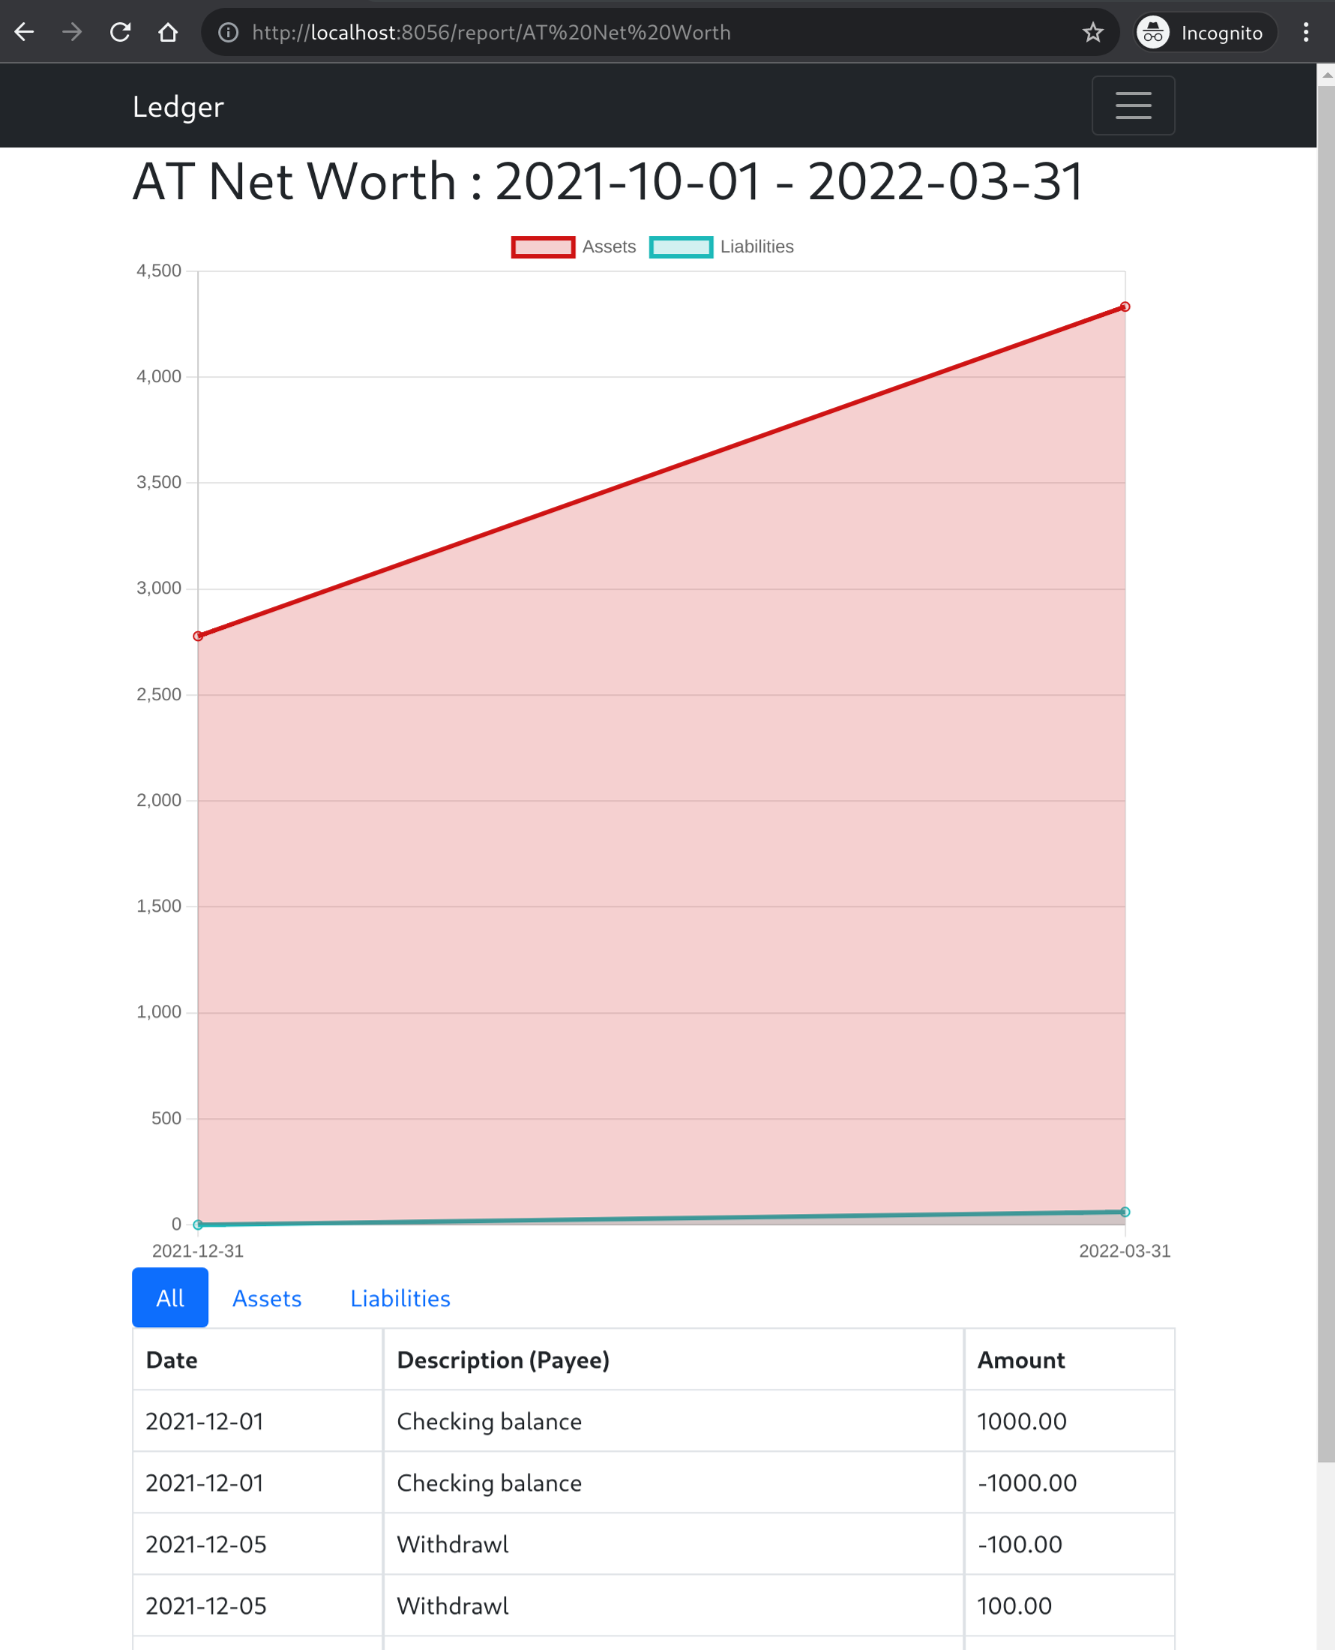
name = "AT Net Worth"
chart = "line"
date_range = "All Time"
date_freq = "Quarterly"
accounts = [ "Assets", "Liabilities" ]
[[report]]
name = "AT Yearly Income"
chart = "bar"
date_range = "All Time"
date_freq = "Yearly"
accounts = [ "Income" ]
Expenses
This is a pie chart showing the spending per Expense account.
Savings
This report calculates a pseudo account "Savings" based on Income - Expenses over time and shows how much money has been saved per month.
Net Worth
Graph Assets against Liabilities.